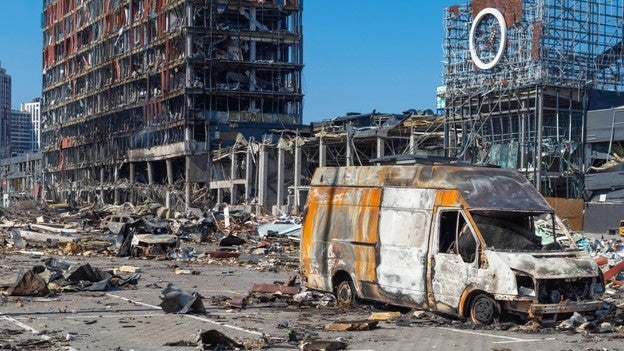
A joint report by Ukraine's environment ministry and climate NGOs has found that, over the first 24 months of war in Ukraine, greenhouse gas (GHG) emissions relating to the conflict have increased to 175 million tCO2e.
The figure is equivalent to the introduction of 90 million new petrol cars or 260 coalfired power units of 200MW each and tops the annual GHG emissions produced by the likes of the Netherlands and other industrialised states. It includes direct emissions from the conflict and those associated with the rebuilding of damaged infrastructure.
Covering the period from 24 February 2022 to 23 February 2024, the report states: “The Russian Federation can be held accountable for these emissions and the resulting damage to the global climate as, without its act of aggression, these GHG emissions would not have happened.”
It notes that 51.6 million tCO2e were attributable to warfare. Of this, 35.2 million came from fuel consumption by Russian troops, 9.4 million from fuel consumption by Ukrainian troops, 4.1 million from use of ammunition, 1.9 million from construction of fortifications and 0.5 million from both military equipment and supply of equipment.
The emissions were primarily from within Ukraine (63%), but a significant portion came from other areas. Of the 51.6 million tCO2e emitted by warfare, 22% came from Russia and Belarus (55% from occupied territories, 20% from government-controlled Ukraine and 3% from the rest of the world).
Reconstruction accounted for 56 million tCO2e of the estimated emissions, landscape fires for 22 million tCO2e and refugees for 3.3 million tCO2e (with 55% of this coming from outside Ukraine, Russia or Belarus).
Of the total emissions, 27% came from government-controlled Ukraine, 36% from occupied territories, 8% from Russia and Belarus and 29% from the rest of the world.
The report states: “Some of the emissions have occurred during the 24 months while others will happen in the future. This is mainly the case for reconstruction emissions, but also relevant for forests dying after intensive wildfires.”
It estimates the total climate damage after 24 months of war to be more than $32bn. Initially, the emissions were primarily attributable to the destruction of civilian infrastructure. Now, the report considers that “the largest share of emissions originate from a combination of warfare, landscape fires and the damage to energy infrastructure.”
Considering the scale of the impact of the conflict, the report adds: “Russia’s war in Ukraine has caused extensive devastation, including the destruction or damage of homes, schools, hospitals, and other critical public facilities, leaving citizens without essential resources such as water, electricity, and healthcare.
“Beside causing damage to the natural environment of Ukraine, this war affects the global climate due to the release of significant amounts of carbon dioxide and other greenhouse gases (GHG) into the atmosphere.”


